Pandasで大規模データを扱う時にメモリ消費を抑える手法を紹介
Aru
Aru's テクログ(Aruaru0)

YOLOv8ではセグメンテーション(Segmentation)タスクもサポートしています。この記事では、独自のカスタムデータセットを用いてセグメンテーションの学習と推論を行う手順について解説します。また、YOLOv8のセグメンテーションの独自の出力フォーマット(アノテーションデータ)についても詳しく解説します。
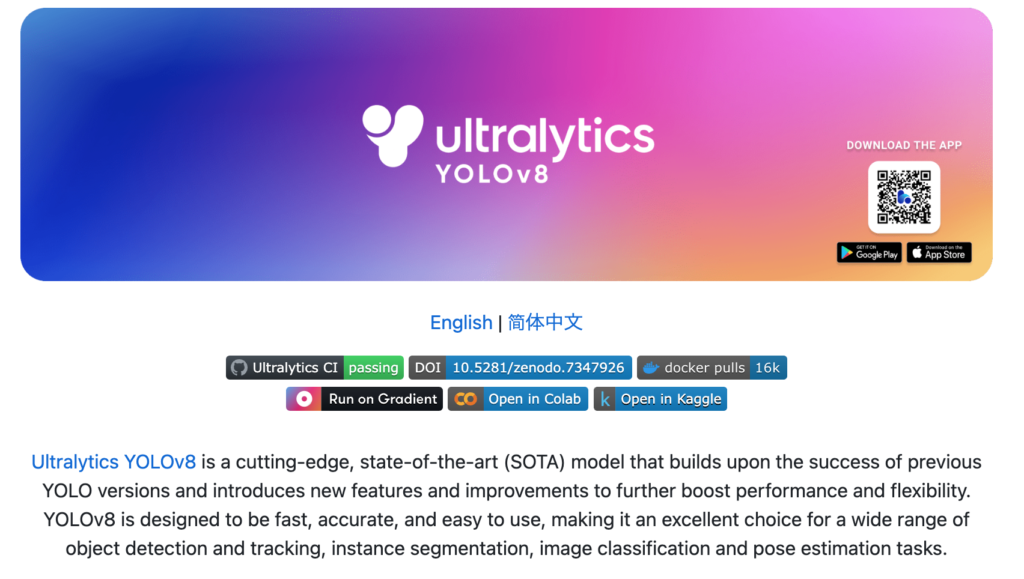
YOLOv8は、Ultralytics社が開発した物体検出モデルです。物体検出以外にもセグメンテーション、姿勢推定などにも利用できます。2023年1月に公開されたモデルということですが、モデルの進化は本当に早いと感じています。
今回はYOLOv8を用いてセグメンテーションを行ってみました。YOLOv8のセグメンテーションのデータはYOLOのフォーマットとなっていて特殊でしたので、フォーマットの確認なども行っています。
セグメンテーションタスクは、与えられた画像をピクセル単位で分割し、各ピクセルが画像内のどのオブジェクトに属するかを識別するタスクです。具体的には、画像内の各ピクセルに対して、それが属する物体のクラスを推定します。
セグメンテーションでは、画像内の各ピクセルを物体クラスに関連付け、例えば「犬」「車」などを識別します。セグメンテーションは、自動運転車の環境認識、医療画像解析、農業、ロボティクス、セマンティックマッピングなどのコンピュータビジョンの多くのアプリケーションで使用されています。
セグメンテーションは、セマンティックセグメンテーションとインスタンスセグメンテーションに分かれるみたいです。
SegFormerを使ってセグメンテーションを行う記事も参考にしてください。

ゼロショットセグメンテーションを実現するSAMについては以下を参考にしてください。

YOLOv8のインストールは簡単です。Google Colabの場合は、以下のコマンドをセルブロックで実行すればOKです。
!pip install ultralyticsデータセットはcoco128-segを利用します(https://ultralytics.com/assets/coco128-seg.zip)。このデータセットは、COCOの画像データセットのサブセットで、128枚の画像が入っています。
定義ファイルcoco128-seg.yamlには、このデータのダウンロード指定も入っており、自動的にダウンロードされますので特にダウンロードしておく必要はありません。
coco128-seg.yamlは、こちらにありますが、これも学習時にダウンロードされるのでダウンロードしておく必要はありません。
YAMLファイルの中身は以下のようになっています。内容的には、train, val, testのフォルダパスと、クラス名です。downloadもオプションで指定できます。
coco128-seg.yaml# Ultralytics YOLO 🚀, AGPL-3.0 license
# COCO128-seg dataset https://www.kaggle.com/ultralytics/coco128 (first 128 images from COCO train2017) by Ultralytics
# Example usage: yolo train data=coco128.yaml
# parent
# ├── ultralytics
# └── datasets
# └── coco128-seg ← downloads here (7 MB)
# Train/val/test sets as 1) dir: path/to/imgs, 2) file: path/to/imgs.txt, or 3) list: [path/to/imgs1, path/to/imgs2, ..]
path: ../datasets/coco128-seg # dataset root dir
train: images/train2017 # train images (relative to 'path') 128 images
val: images/train2017 # val images (relative to 'path') 128 images
test: # test images (optional)
# Classes
names:
0: person
1: bicycle
2: car
: (略)
77: teddy bear
78: hair drier
79: toothbrush
# Download script/URL (optional)
download: https://ultralytics.com/assets/coco128-seg.zip学習済みモデルとしては、セグメンテーションタスク向けに学習されたyolov8n-seg.ptも用意されていますが、ここでは、物体検出タスク向けに学習したyolov8n.ptをセグメンテーション用モデル(yolov8n-seg.yaml)に読み込む形とします。
学習済みモデルが学習したデータと同じCOCOデータで学習しても意味がないのでこのようにしました。
from ultralytics import YOLO

# Load a model
model = YOLO('yolov8n-seg.yaml').load('yolov8n.pt') # build from YAML and transfer weights次は、学習です。学習データの設定が書かれたファイル(coco128-seg.yaml)を指定して実行します。また、epoch数は100, 画像サイズは640を指定しました。
学習コードは以下の通りです。train()のオプションは、以下の記事または、公式サイトを参考にしてください。
results = model.train(data='coco128-seg.yaml', epochs=100, imgsz=640)以下は、学習の経過の一部です。正しく動作すれば、このようなログが表示されます。
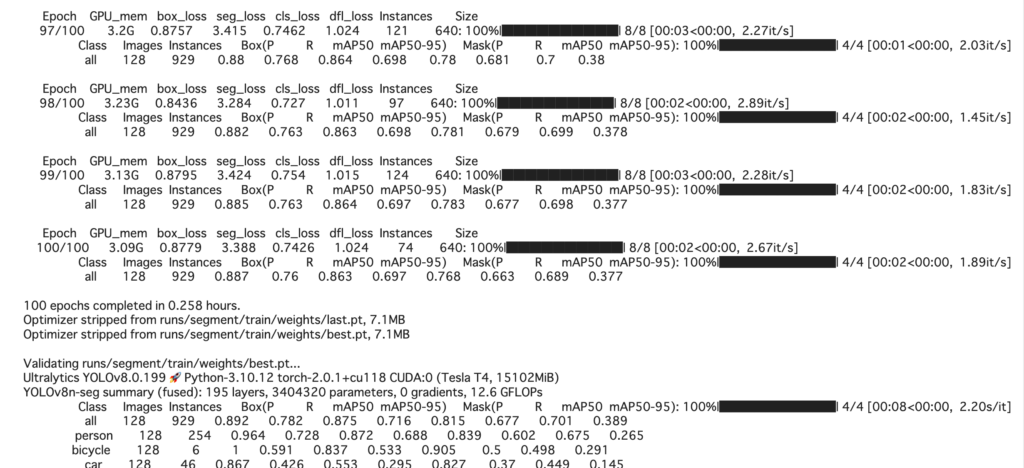
学習結果を見ると、MaskのmAP50も0.701とある程度は学習できている数値になっています。
Class     Images  Instances
all        128        929
Box(P          R      mAP50  mAP50-95)
 0.892      0.782      0.875      0.716
Mask(P          R      mAP50  mAP50-95)
0.815 0.677 0.701 0.389結果の検証を行うには、以下のコードを実行します。学習時に結果は出力されているので、別途検証を行いたい場合でなければ、検証は行う必要ないかもしれません。
metrics = model.val()戻り値のmetricsには以下のような結果が格納されています。
| BOX | metrics.box.map | mAP50-95 |
metrics.box.map50 | mAP50 | |
metrics.box.map75 | mAP75 | |
metrics.box.maps | クラス毎のmAP50-95 | |
| セグメンテーション | metrics.seg.map | mAP50-95 |
metrics.seg.map50 | mAP50 | |
metrics.seg.map75 | mAP75 | |
metrics.seg.maps | クラス毎のmAP50-95 |
mAP(Mean Average Precision)は、セグメンテーションタスクなどのオブジェクト検出やセマンティックセグメンテーションなどのタスクにおいて、モデルの性能を評価するための一般的な指標なので、計算方法などはここでは割愛しますが、1に近いほど性能が高いことを示します。
YOLOv8のアノテーションデータおよび、出力結果はYOLO独自のフォーマットになっています。アノテーションファイルは以下の構造になっています。
<class-index> <x1> <y1> <x2> <y2> ... <xn> <yn>この意味は、class-indexで示されるオブジェクトが(x1, y1) → (x2, y2)→…→(xn, yn)という多角形に囲まれた領域に存在するということです。
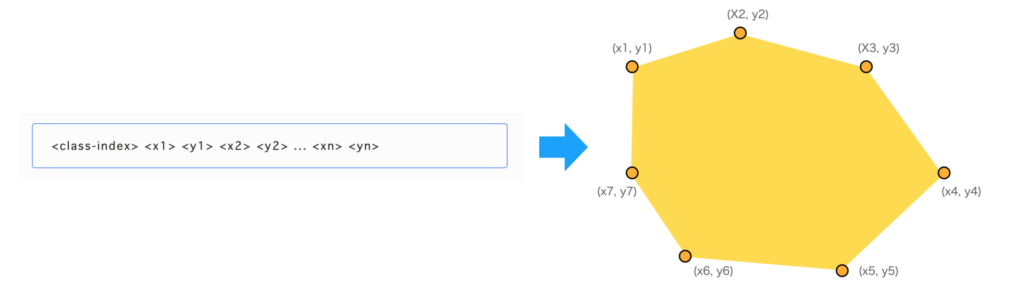
複数のオブジェクトがある場合は、この行が複数並びます。
出力結果も、これと同じフォーマットになります。
学習画像にアノテーション結果を重ねて表示させたい場合は、例えば以下のようなコードで行うことができます。
画像ファイルを読み込みます。colabでは、cv2.imshowが動作しないので、colabで実行する場合は、
from google.colab.patches import cv2_imshow
をインポートしておきます。また、cv2.im_show()の代わりにcv2_imshow()を利用します。
import cv2
from google.colab.patches import cv2_imshow

imgfile = "/content/datasets/coco128-seg/images/train2017/000000000605.jpg"
txtfile = "/content/datasets/coco128-seg/labels/train2017/000000000605.txt"

img = cv2.imread(imgfile)次に、テキストファイルを読み込み、クラスIDをclsに、マスクをpolyに格納します。
import numpy as np
cls = []
poly = []
w, h = img.shape[1], img.shape[0]
with open(txtfile, "r") as f :
for line in f:
x = list(map(float, line.split()))
cls.append(int(x[0]))
y = np.array(x[1:]).reshape(-1,2)
y[:,0] = y[:,0] * w
y[:,1] = y[:,1] * h
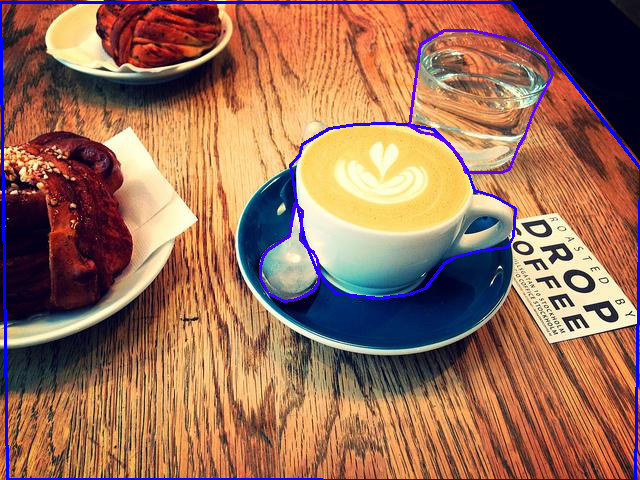
poly.append(y)最後に、結果を描画します。今回は塗りつぶさずに領域を線で囲っています。
for i, e in enumerate(poly) :
  pos = e.reshape((-1,1,2)).astype(np.int32)
  cv2.polylines(img, [pos], isClosed=True, color= (255, 0, 32*i), thickness=2)
  # cv2.fillPoly(img, [pos], color= (255, 0, 32*i))

cv2_imshow(img)
結果は以下のようになります。
YOLOv8の結果の可視化は、supervisonを利用すると便利です。詳細は以下の記事を参考にしてください。

学習したモデルを使って、実際に予測を行ってみます。
まず、wgetでデータを撮ってきます。wgetでUTF-8に関するエラーが出る場合は、以下のコードを実行します。
import locale
locale.getpreferredencoding = lambda: "UTF-8"
!wget https://ultralytics.com/images/bus.jpg次に、先ほど学習したモデルを読み込み、予測を行います。
model = YOLO('/content/runs/segment/train/weights/last.pt')
img = cv2.imread('./bus.jpg')
results = model(img, save=True, save_txt=True)
save=True, save_txt=Trueを指定しているので、./run/predict/フォルダにラベルと結果画像が格納されているはずです。そちらも確認してください。
検出したクラス一覧を表示してみます。
# オブジェクトの種類を調べる
for e in results[0].boxes.cls.cpu():
  print(e, model.names[int(e)])
ensor(0.) person
tensor(0.) person
tensor(0.) person
tensor(0.) person
tensor(5.) bus人が4つとバスを1つ見つけたようです。
なお、結果には、results[0].boxes, results[0].masksでアクセスできます。
results[0].boxesultralytics.engine.results.Boxes object with attributes:
cls: tensor([0., 0., 0., 0., 5.], device='cuda:0')
conf: tensor([0.9592, 0.9087, 0.9010, 0.4906, 0.4893], device='cuda:0')
data: tensor([[5.1545e+01, 4.0126e+02, 2.4082e+02, 8.9826e+02, 9.5918e-01, 0.0000e+00],
[2.1993e+02, 4.0632e+02, 3.4357e+02, 8.5763e+02, 9.0866e-01, 0.0000e+00],
[6.6932e+02, 3.8419e+02, 8.0982e+02, 8.7788e+02, 9.0104e-01, 0.0000e+00],
[4.6940e-01, 5.5377e+02, 6.5175e+01, 8.7878e+02, 4.9061e-01, 0.0000e+00],
[1.7728e+01, 2.2526e+02, 8.0518e+02, 7.6442e+02, 4.8932e-01, 5.0000e+00]], device='cuda:0')
:
(略)results[0].masksultralytics.engine.results.Masks object with attributes:
data: tensor([[[0., 0., 0., ..., 0., 0., 0.],
[0., 0., 0., ..., 0., 0., 0.],
[0., 0., 0., ..., 0., 0., 0.],
...,
[0., 0., 0., ..., 0., 0., 0.],
[0., 0., 0., ..., 0., 0., 0.],
[0., 0., 0., ..., 0., 0., 0.]],
[[0., 0., 0., ..., 0., 0., 0.],
[0., 0., 0., ..., 0., 0., 0.],
[0., 0., 0., ..., 0., 0., 0.],
...,
(略)入力画像を表示してみます。
from google.colab.patches import cv2_imshow
import cv2
import numpy as np
cv2_imshow(img)
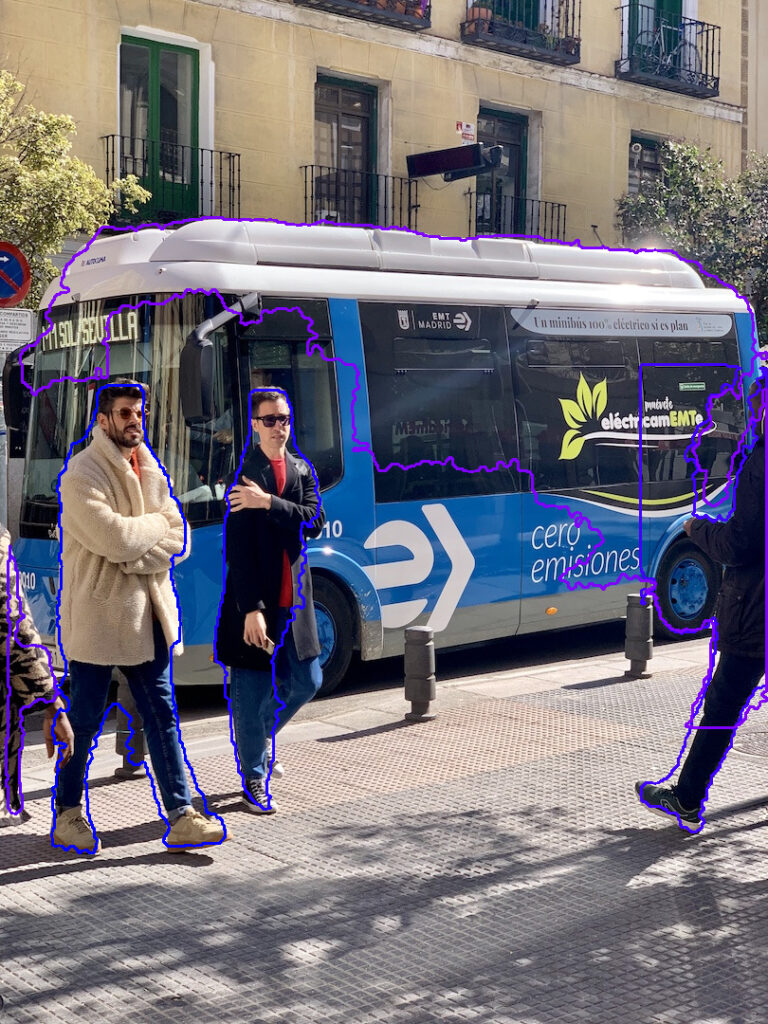
検出結果を重畳してみます。
for i, e in enumerate(results[0].masks.cpu().xy) :
  pos = e.reshape((-1,1,2)).astype(np.int32)
  cv2.polylines(img, [pos], isClosed=True, color= (255, 0, 32*i), thickness=2)
  # cv2.fillPoly(img, [pos], color= (255, 0, 32*i))

cv2_imshow(img)
ある程度は正解に近づいていますが、学習が不十分にみえます。128枚の画像で100EPOCHだとこんなものかもしれません。
YOLOv8を使ってセグメンテーションを行ってみました。物体検出の時にも感じましたが、YOLOv8は環境がかなり整備されていて使いやすいです。その分、コード変更などがやりにくいのかもしれませんが、物体検出モデルの変更はそもそも面倒なので、そのまま利用することが多い印象です。そういう意味では、使いやすさが高いYOLOv8は、利用するモデルの選択肢として有用な気がします。
centernetを自作したことありますが、物体検出モデルはモデル自身より、枠情報→入力データや、出力データ→枠情報への変換などの、周辺処理を記述するのが面倒な印象です。