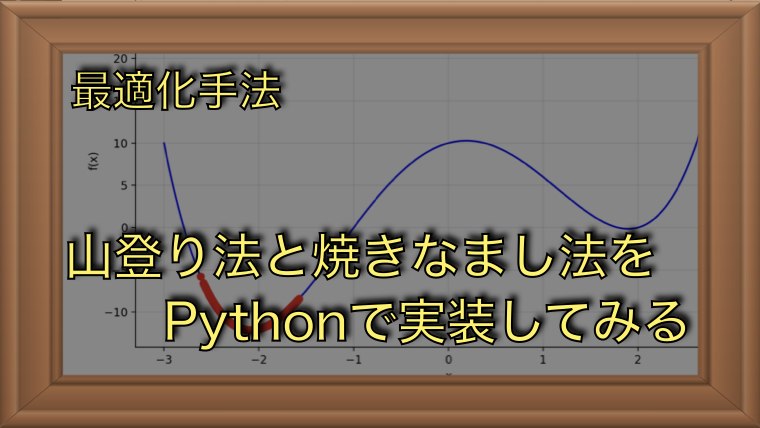
最適化アルゴリズム:「山登り法」と「焼きなまし法」をPythonで実装

この記事では、最適化アルゴリズムの「山登り法」と「焼きなまし法」をPythonで実装し、それぞれの特徴を解説します。この記事は、実例を通じて最適化手法についての理解を深めるのに役立ちます。
2つの最適化手法
山登り法 (Hill Climbing)
山登り法は、局所的最適解を求める探索アルゴリズムです。基本的には現在の解を基に隣接する解を評価し、改善できる方向に進めます。
- 特徴
- 現在の解を改善するために、隣接解を探索する
- 課題
- 局所最適解に陥りやすい
- 初期値の影響を受けやすい
焼きなまし法 (Simulated Annealing)
焼きなまし法は、山登り法の課題を改善するために、確率的要素な遷移を取り入れたアルゴリズムです。具体的には、冷却スケジュールに従って探索を進め、最初は一定確率で悪化する方向にもランダムに遷移し、徐々に悪化方向に遷移する確率を小さくしていきます。
- 特徴
- 局所的最適解から脱出することができる
- 課題
- パラメータ設定(初期温度や冷却スケジュール)に大きく依存する
- 処理時間が長くなる傾向がある
この記事では、この2つの手法について探索を行うサンプルを使ってコードの書き方を解説します。
探索に利用するグラフ(数式)
山と谷が複数ある関数を選択
今回、山登り法と焼きなまし法をテストするのは以下の数式のグラフの最小値を求める問題です。山登り法の課題がわかるように谷が2つある数式としました。
$$
f(x) = x^4 – 8x^2 + 3x + 10
$$
def f(x):
    # f(x) = x^4 - 8x^2 + 3x + 10
    return (x**4) - 8*(x**2) + 3*x + 10
グラフで確認
式をグラフにプロットすると以下のようになります。グラフからわかるように、-2付近と2付近に極値を持つグラフになります。また、0付近には少し高い山がああり、左右の極小値から反対側の極値に移動するには、山を越える必要があります。


この関数を選択した理由は、山登り法のデメリットと焼きなまし法のメリットを理解するのに良さそうだからです。
コードサンプル
山登り法
山登り法では、探索の初期位置xからΔt(デルタ)だけ離れた点の$f(x+\delta t)$を計算し、計算した値が小さい場合に、current_xを更新します。つまり、より小さな値が見つかった場合に値を更新するという手法になります。
下記は、山登り法のプログラムです。
山登りを行う関数がhill_climbing()です。plot_result()は、探索結果をグラフ化する関数です。
import random
import matplotlib.pyplot as plt
import numpy as np
import math

# 山登り法の実装
def hill_climbing(func, initial_x, step_size=0.1, max_iterations=1000):
    """
    山登り法を使用して最大値を探索する。

    Args:
        func (function): 評価する目的関数。
        initial_x (float): 探索の初期位置。
        step_size (float): 位置を更新する際のステップ幅。
        max_iterations (int): 最大反復回数。

    Returns:
        dict: 'best_x'(最適なx値)と 'best_value'(目的関数の最大値)
              'x', 'y'(探索過程の履歴)を含む辞書。
    """
    current_x = initial_x
    current_y = func(current_x)

    x = [current_x]
    y = [current_y]

    for iteration in range(max_iterations):
        # ランダムに次の候補を選択
        candidate_x = current_x + random.uniform(-step_size, step_size)
        candidate_y = func(candidate_x)

        # 履歴を記録
        x.append(candidate_x)
        y.append(candidate_y)

        # 値が改善したら更新
        if candidate_y < current_y:
            current_x = candidate_x
            current_y = candidate_y

    return {
        "best_x": current_x,
        "best_value": current_y,
        "x" : x,
        "y" : y
    }

def plot_result(history_x, history_y, f) :
    x = np.linspace(-3, 3, 1000)
    y = f(x)
    plt.figure(figsize=(10, 6))
    plt.plot(x, y, label="Objective Function", color="blue")
    if len(history_x) != 0:
        plt.scatter(history_x, history_y, color="red", label="Search Path", zorder=5)
    plt.title("Hill Climbing Search Path")
    plt.xlabel("x")
    plt.ylabel("f(x)")
    plt.legend()
    plt.grid(alpha=0.3)
    plt.show()

# テスト用の目的関数(局所的な極小値/極大値を持つ関数)
def f(x):
    # f(x) = x^4 - 8x^2 + 3x + 10
    return (x**4) - 8*(x**2) + 3*x + 10


# 山登り法を実行
initial_x = random.uniform(-3, 3)  # 初期位置をランダムに設定
step_size = 0.5
max_iterations = 1000

result = hill_climbing(f, initial_x, step_size, max_iterations)
print("Initial x:", initial_x)
print("Best x:", result["best_x"])
print("Best value:", result["best_value"])
plot_result(result["x"], result["y"], f)
この関数を実行すると以下のようなグラフが表示されます。初期値等に乱数を使っているので、試行ごとに結果が変化します。ここでは、2つの試行結果を紹介し、山登り法について解説します。
試行:1回目
試行1回目のグラフです。青い線が$f(x)$で、赤い点が探索した$x$になります。
1回目の試行は、初期値$x$が悪かったため、局所解に収束していることがわかります。今回の問題(関数)のように複数の山がある場合、山登り法は初期値$x$によっては、局所解に収束してしまうという欠点があります。

試行:2回目
2回目の試行のグラフです。初期値$x$が適切だったので、最小値に収束しています。

焼きなまし法(アニーリング)
山登り法では、初期値の影響を受けて局所解に収束してしまうのが問題でした。焼きなまし法(アニーリング)は、温度というパラメータを使い、温度が高いうちは$x$が悪化する場合も一定確率で遷移することで、局所解から脱出する方法です。
以下が、焼きなまし法のプログラムです。
焼きなまし法では、以下のような確率Pで状態遷移を行います(メトロポリス法などと呼ばれています)。
$$
P(\Delta E) = \begin{cases} 1, & \text{if } \Delta E \leq 0 \\ e^{-\frac{\Delta E}{T}}, & \text{if } \Delta E > 0 \end{cases}
$$
これを実際に実装している部分が以下のコードになります。
if delta_e < 0 or random.random() < math.exp(-delta_e / temperature)
メトロポリス法は、物理学の統計力学で導入された手法で、熱平衡状態における系の状態をシミュレーションするためのアルゴリズムです。この方法は特にモンテカルロ法(確率的手法)の一種として知られています。
import random
import matplotlib.pyplot as plt
import numpy as np
import math


def simulated_annealing(func, initial_x, initial_temp, cooling_rate, min_temp, max_iterations):
    """
    アニーリング法を使用して最小値を探索する。

    Args:
        func (function): 評価する目的関数。
        initial_x (float): 探索の初期位置。
        initial_temp (float): 初期温度。
        cooling_rate (float): 温度の減少率。
        min_temp (float): 最低温度(停止条件)。
        max_iterations (int): 最大反復回数。

    Returns:
        dict: 'best_x'(最適なx値)、'best_value'(目的関数の最小値)、
              'x', 'y'(探索過程の履歴)を含む辞書。
    """
    current_x = initial_x
    current_y = func(current_x)
    best_x = current_x
    best_value = current_y
    temperature = initial_temp

    x = [current_x]
    y = [current_y]

    for iteration in range(max_iterations):
        if temperature < min_temp:
            break

        # ランダムに次の候補を選択
        candidate_x = current_x + random.uniform(-1, 1)
        candidate_y = func(candidate_x)

        # 差分エネルギーを計算
        delta_e = candidate_y - current_y

        # 遷移確率を計算
        if delta_e < 0 or random.random() < math.exp(-delta_e / temperature):
            current_x = candidate_x
            current_y = candidate_y

            # 最良解を更新
            if current_y < best_value:
                best_x = current_x
                best_value = current_y

        # 履歴を記録
        x.append(candidate_x)
        y.append(candidate_y)
        # 温度を冷却
        temperature *= cooling_rate

    return {
        "best_x": best_x,
        "best_value": best_value,
        "x" : x,
        "y" : y
    }

def plot_result(history_x, history_y, f) :
    x = np.linspace(-3, 3, 1000)
    y = f(x)
    plt.figure(figsize=(10, 6))
    plt.plot(x, y, label="Objective Function", color="blue")
    if len(history_x) != 0:
        plt.scatter(history_x, history_y, color="red", label="Search Path", zorder=5)
    plt.title("Hill Climbing Search Path")
    plt.xlabel("x")
    plt.ylabel("f(x)")
    plt.legend()
    plt.grid(alpha=0.3)
    plt.show()

# テスト用の目的関数(局所的な極小値/極大値を持つ関数)
def f(x):
    # f(x) = x^4 - 8x^2 + 3x + 10
    return (x**4) - 8*(x**2) + 3*x + 10


# 焼きなまし法を実行
initial_x = random.uniform(-3, 3)  # 初期位置をランダムに設定
step_size = 0.5
max_iterations = 1000
result = simulated_annealing(f, initial_x, 100, 0.99, 0.01, max_iterations)
print("Initial x:", initial_x)
print("Best x:", result["best_x"])
print("Best value:", result["best_value"])

plot_result(result["x"], result["y"], f)
焼きなまし法も、乱数を用いているので試行により結果が変化します。こちらも2回の試行結果を比較して解説します。
試行:1回目
試行1回目のグラフです。中央の山を越えて探索が行われていることがわかります。

試行:2回目
試行の2回目のグラフです。こちらも1回目と同様に中央の山を越えた探索が行われています。

焼きなまし方では、今回はどちらも最小値(付近)に収束することができました。
焼きなまし法の問題点
焼きなまし法が常に最適解に辿りつけるわけではないことに注意が必要です。今回は比較的簡単な問題だったのでうまくいきましたが、複雑な問題の場合は局所解で停止することも多いです。
特に、焼きなまし法では、初期温度、冷却スケジュール(温度の低下率)、停止基準などのパラメータ設定が重要です。これらのパラメータを適切に設定しないと、最適解に到達できない、または計算時間が無駄に長くなる可能性が高まります。
まとめ
以上、山登り法と焼きなまし法を、実際のコードを示しながら解説しました。最適化手法としては基本となるものなので理解しておきましょう。
付録(コード全体)
以下、両手法を1つのコードにまとめたものです。
import random
import matplotlib.pyplot as plt
import numpy as np
import math

# 山登り法の実装
def hill_climbing(func, initial_x, step_size=0.1, max_iterations=1000):
    """
    山登り法を使用して最大値を探索する。

    Args:
        func (function): 評価する目的関数。
        initial_x (float): 探索の初期位置。
        step_size (float): 位置を更新する際のステップ幅。
        max_iterations (int): 最大反復回数。

    Returns:
        dict: 'best_x'(最適なx値)と 'best_value'(目的関数の最大値)
              'x', 'y'(探索過程の履歴)を含む辞書。
    """
    current_x = initial_x
    current_y = func(current_x)

    x = [current_x]
    y = [current_y]

    for iteration in range(max_iterations):
        # ランダムに次の候補を選択
        candidate_x = current_x + random.uniform(-step_size, step_size)
        candidate_y = func(candidate_x)

        # 履歴を記録
        x.append(candidate_x)
        y.append(candidate_y)

        # 値が改善したら更新
        if candidate_y < current_y:
            current_x = candidate_x
            current_y = candidate_y

    return {
        "best_x": current_x,
        "best_value": current_y,
        "x" : x,
        "y" : y
    }


def simulated_annealing(func, initial_x, initial_temp, cooling_rate, min_temp, max_iterations):
    """
    アニーリング法を使用して最小値を探索する。

    Args:
        func (function): 評価する目的関数。
        initial_x (float): 探索の初期位置。
        initial_temp (float): 初期温度。
        cooling_rate (float): 温度の減少率。
        min_temp (float): 最低温度(停止条件)。
        max_iterations (int): 最大反復回数。

    Returns:
        dict: 'best_x'(最適なx値)、'best_value'(目的関数の最小値)、
              'x', 'y'(探索過程の履歴)を含む辞書。
    """
    current_x = initial_x
    current_y = func(current_x)
    best_x = current_x
    best_value = current_y
    temperature = initial_temp

    x = [current_x]
    y = [current_y]

    for iteration in range(max_iterations):
        if temperature < min_temp:
            break

        # ランダムに次の候補を選択
        candidate_x = current_x + random.uniform(-1, 1)
        candidate_y = func(candidate_x)

        # 差分エネルギーを計算
        delta_e = candidate_y - current_y

        # 遷移確率を計算
        if delta_e < 0 or random.random() < math.exp(-delta_e / temperature):
            current_x = candidate_x
            current_y = candidate_y

            # 最良解を更新
            if current_y < best_value:
                best_x = current_x
                best_value = current_y

        # 履歴を記録
        x.append(candidate_x)
        y.append(candidate_y)
        # 温度を冷却
        temperature *= cooling_rate

    return {
        "best_x": best_x,
        "best_value": best_value,
        "x" : x,
        "y" : y
    }

def plot_result(history_x, history_y, f) :
    x = np.linspace(-3, 3, 1000)
    y = f(x)
    plt.figure(figsize=(10, 6))
    plt.plot(x, y, label="Objective Function", color="blue")
    if len(history_x) != 0:
        plt.scatter(history_x, history_y, color="red", label="Search Path", zorder=5)
    plt.title("Hill Climbing Search Path")
    plt.xlabel("x")
    plt.ylabel("f(x)")
    plt.legend()
    plt.grid(alpha=0.3)
    plt.show()

# テスト用の目的関数(局所的な極小値/極大値を持つ関数)
def f(x):
    # f(x) = x^4 - 8x^2 + 3x + 10
    return (x**4) - 8*(x**2) + 3*x + 10

plot_result([], [], f)


# 山登り法を実行
initial_x = random.uniform(-3, 3)  # 初期位置をランダムに設定
step_size = 0.5
max_iterations = 1000

result = hill_climbing(f, initial_x, step_size, max_iterations)
print("Initial x:", initial_x)
print("Best x:", result["best_x"])
print("Best value:", result["best_value"])
plot_result(result["x"], result["y"], f)

# 焼きなまし法を実行
initial_x = random.uniform(-3, 3)  # 初期位置をランダムに設定
step_size = 0.5
max_iterations = 1000
result = simulated_annealing(f, initial_x, 100, 0.99, 0.01, max_iterations)
print("Initial x:", initial_x)
print("Best x:", result["best_x"])
print("Best value:", result["best_value"])

plot_result(result["x"], result["y"], f)


