


2つの数列から和がXになる組み合わせを数える方法|O(NM)から辞書・二分探索まで解説【Python】
Aru
Aru's テクログ(Aruaru0)

matplotlib.animationを使ってグラフアニメーションを作成する方法は、Google Colab上ではそのままでは動作しません。本記事では、Google ColabでMatplotlibを使用してグラフをアニメーションさせる具体的な手順と設定方法を解説します。これにより、Google Colab環境でもスムーズにアニメーションを実現できるようになります。
Jupyter notebookの場合、matplotlib.animationをインポートした後に以下のマジックコマンドを追加することでアニメーションを追加することが可能です。
%matplotlib nbaggただ、Google Colabではnbaggを設定しただけではアニメーションできません。
これに加えて以下のコードでjavascriptでアニメーションさせるように設定する必要があります
from matplotlib import animation, rc

rc('animation', html='jshtml')
上記の2つをおまじないと思って記述しておけばOKです
Google Colabでアニメーションさせたい場合は、以下のコードを最初にいれておけばOKです。
from matplotlib import animation, rc

%matplotlib nbagg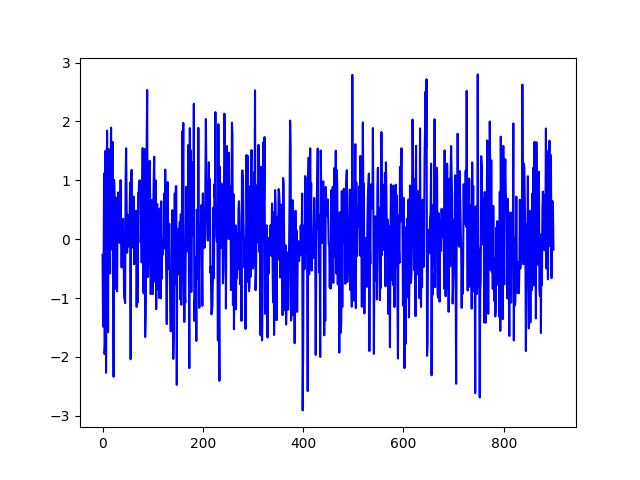
rc('animation', html='jshtml')animation.ArtistAnimation最初にplt.plotで複数のグラフを作成しておき、これをアニメーションさせる例です。
animation.ArtistAnimationを利用してアニメーションを生成させます。
import numpy as np
import matplotlib.pyplot as plt
from matplotlib import animation, rc
%matplotlib nbagg
rc('animation', html='jshtml')

fig = plt.figure()
ims = []
rand = np.random.randn(1000)
for i in range(10):
  im = plt.plot(rand[i*10:900+i*10],'b')
  ims.append(im)

ani = animation.ArtistAnimation(fig, ims,interval=100)

ani
表示は以下のようになります。
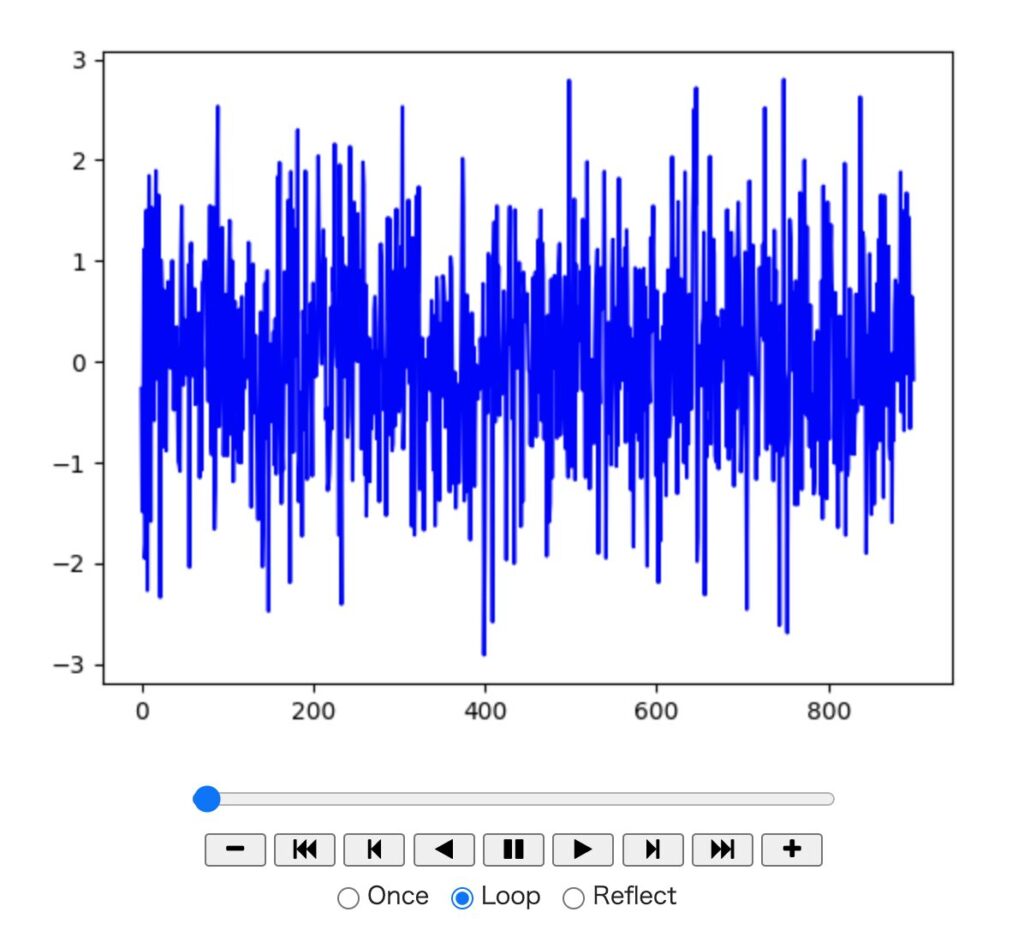
アニメーションは以下のようになります
また、アニメーションは、以下のコードでgifファイルとして保存できます
ani.save("xxx.gif")animation.FuncAnimationplotデータを動的に生成する例です。
表示するデータを作成する関数(例ではplot())を作成しておき、呼び出します。
動的に生成する場合はanimation.FuncAnimationを利用してアニメーションを生成します。
Colabで表示させるには、何フレーム(何枚)の画像を生成させるかを指定する引数framesを指定する必要があります。
import numpy as np
import matplotlib.pyplot as plt
from matplotlib import animation, rc
%matplotlib nbagg
rc('animation', html='jshtml')

v = np.random.randn(200)

def plot(data):
    plt.cla()
    plt.plot(v[data: data+100])
    plt.tick_params(
      axis='x',
      which='both',
      bottom=True,
      top=False,
      labelbottom=False)

fig = plt.figure()
ani = animation.FuncAnimation(fig, plot, interval=10, frames=100)

ani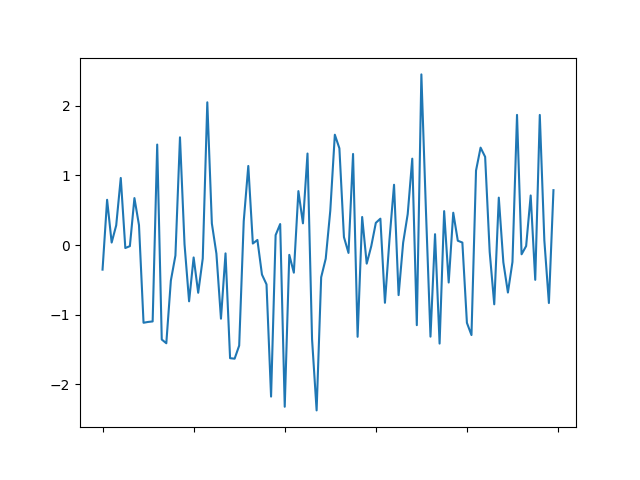
Google Colabでグラフをアニメーションさせようとして、動かなくてハマったので、調査した結果を記事にしてみました。動作サンプルもつけたので、参考になれば幸いです。