scikit-learnで機械学習用データセットを自動生成する方法【初級 深層学習講座】

この記事では、scikit-learn(sklearn)を使って実験用データセットを自動生成する方法を紹介します。これを覚えておけば、データセットがなくても機械学習の実験を行うことができます。具体的には、make_classification、make_regression、make_blobsといった関数を使ってデータセットを生成する手順を詳しく解説します。これらの関数を使うことで、分類、回帰、クラスタリングといったタスクに適したデータを簡単に作成できます。「機械学習を学びたいけれど、適当なデータセットがない」と困っている方は、ぜひ試してみてください。
sklearnのdatasetジェネレータについて
sklearn.datasetsには、データセットを生成するためのジェネレータがいくつか用意されています。以下の表はsklearnで用意されているジェネレータの一覧です。
この記事では、この中から以下の3つのデータセットの生成方法について解説します。
- クラス分類(
make_classification) - 回帰(
make_regression) - ガウス分布に基づく分類(
make_blobs)
パラメータは異なりますが基本的にはどれも似たような感じで利用できます
| ジェネレータ名 | 説明 |
datasets.make_biclusters(shape, n_clusters, *) | Generate a constant block diagonal structure array for biclustering. |
datasets.make_blobs([n_samples, n_features, …]) | Generate isotropic Gaussian blobs for clustering. |
datasets.make_checkerboard(shape, n_clusters, *) | Generate an array with block checkerboard structure for biclustering. |
datasets.make_circles([n_samples, shuffle, …]) | Make a large circle containing a smaller circle in 2d. |
datasets.make_classification([n_samples, …]) | Generate a random n-class classification problem. |
datasets.make_friedman1([n_samples, …]) | Generate the “Friedman #1” regression problem. |
datasets.make_friedman2([n_samples, noise, …]) | Generate the “Friedman #2” regression problem. |
datasets.make_friedman3([n_samples, noise, …]) | Generate the “Friedman #3” regression problem. |
datasets.make_gaussian_quantiles(*[, mean, …]) | Generate isotropic Gaussian and label samples by quantile. |
datasets.make_hastie_10_2([n_samples, …]) | Generate data for binary classification used in Hastie et al. 2009, Example 10.2. |
datasets.make_low_rank_matrix([n_samples, …]) | Generate a mostly low rank matrix with bell-shaped singular values. |
datasets.make_moons([n_samples, shuffle, …]) | Make two interleaving half circles. |
datasets.make_multilabel_classification([…]) | Generate a random multilabel classification problem. |
datasets.make_regression([n_samples, …]) | Generate a random regression problem. |
datasets.make_s_curve([n_samples, noise, …]) | Generate an S curve dataset. |
datasets.make_sparse_coded_signal(n_samples, …) | Generate a signal as a sparse combination of dictionary elements. |
datasets.make_sparse_spd_matrix([n_dim, …]) | Generate a sparse symmetric definite positive matrix. |
datasets.make_sparse_uncorrelated([…]) | Generate a random regression problem with sparse uncorrelated design. |
datasets.make_spd_matrix(n_dim, *[, …]) | Generate a random symmetric, positive-definite matrix. |
datasets.make_swiss_roll([n_samples, noise, …]) | Generate a swiss roll dataset. |

生成するときのパラメータが不適切だとパラメータエラーが発生します。エラーメッセージをみると理由がきちんと記載されていますのでそこを修正しましょう
クラス分類データセット生成(make_classification)
make_classificationを使うことで、クラス分類のためのランダムなデータセットを生成できます。
以下は、make_classificationの引数(一部)です
| 引数 | 説明 |
| n_samples | サンプルの数 |
| n_features | 特徴量の数(次元数) |
| n_informative | 有益(目的変数と相関が高い)特徴量の数 |
| n_redundant | 冗長な特徴量の数 |
| n_repeat | 重複する特徴量の数 |
| n_classes | クラス分類の数 |
| n_clusters_per_class | クラス毎のクラスターの数 |
| random_state | 乱数のシード |

当然ですが、n_informative+n_redundant <= n_featuresである必要があります
2クラス分類
2クラス分類の例です。
2次元のグラフにプロットしやすいように、特徴量は2(n_features=2)としました。
n_classes=2とすることで2クラス分類のデータセットを生成しています。また、制約条件を満たすために、n_redundantを0に設定しています(デフォルトは2)。
import numpy as np
import matplotlib.pyplot as plt
from sklearn.datasets import make_classification

X, y = make_classification(n_samples=1000,
                           n_features=2,
                           n_redundant = 0,
                           n_classes=2,
                           random_state=42)

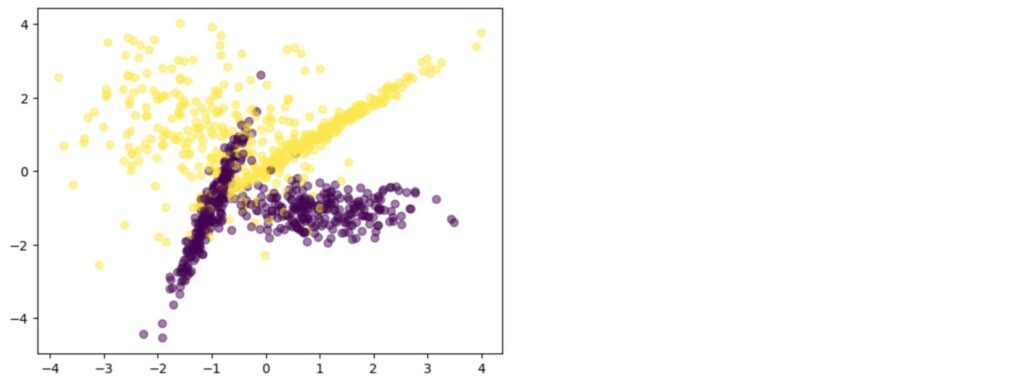
plt.scatter(X[:, 0], X[:, 1], c = y, alpha = 0.5)以下は、グラフです。n_clusters_per_classがデフォルト2なので、各クラス2つの塊があることがわかります。

多クラス分類
make_classificationを利用することで多クラス分類のデータセットも簡単につくることが可能です。以下は3クラスのデータセットの例です。データセットの制約条件を満たすために、n_redundant, n_informative, n_clusters_per_classを設定しています。

表示されるエラーを見ながら修正すればOKです。
import numpy as np
import matplotlib.pyplot as plt
from sklearn.datasets import make_classification

X, y = make_classification(n_samples=1000,
                           n_features=2,
                           n_redundant = 0,
                           n_informative = 2,
                           n_clusters_per_class = 1,
                           n_classes=3,
                           random_state=42)

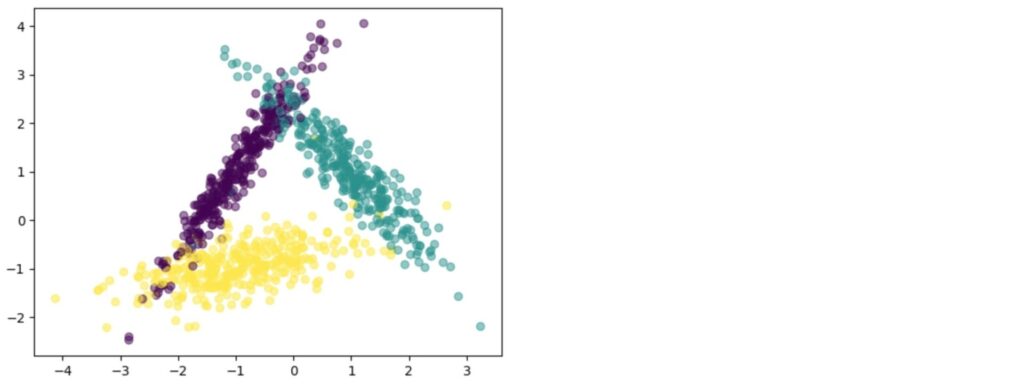
plt.scatter(X[:, 0], X[:, 1], c = y, alpha = 0.5)以下は生成した3クラス分類のデータセットのプロットです。n_clusters_per_classを1にしたので、それぞれの分類のクラスタは1つずつになっています。

回帰データセット生成(make_regression)
make_regressionを用いることで回帰のためのデータセットを生成します
以下は、make_regressionの引数(一部)です。
| 引数 | 説明 |
| n_samples | サンプルの数 |
| n_features | 特徴量の数(次元数) |
| n_informative | 有益(目的変数と相関が高い)特徴量の数 |
| n_targets | 回帰ターゲットの数。yのベクトルの次元数 |
| bias | バイアス(線形モデルの切片) |
| noise | ノイズ量(ガウスノイズの量) |
| coef | Trueを設定すると線形モデルの計数を返す |
| random_state | 乱数のシード |
以下は、回帰データセットを生成するサンプルです。n_informativeの動きがわかるように、n_feartures=2, n_informative=1でデータを作成しました。
import numpy as np
import matplotlib.pyplot as plt
from sklearn.datasets import make_regression

X, Y, coef = make_regression(random_state=42,
                       n_samples=1000,
                       n_features=2,
                       n_informative=1,
                       noise=2,
                       bias=0.0,
                       coef=True)


print(coef)
plt.figure(figsize=(15, 4))
plt.subplot(1, 2, 1)
plt.scatter(X[:, 0], Y)
plt.plot(Y/coef[0], Y, c="red", linestyle="--")

plt.subplot(1, 2, 2)
plt.scatter(X[:, 1], Y, c="green")
2つのグラフは、特徴量1(X[:, 0])とyの関係と特徴量2(X[:, 1])とyの関係をプロットしたものです。n_informativeを1に設定したので特徴量1はyとの相関が高く、特徴量2は相関が低くなっていることがわかります。

相関の高い特徴量と低い特徴量を作る理由
機械学習のモデルが、自動的に相関の高い部分を見つけて予測ができるかをチェックするためには、相関の低い特徴量が含まれている必要があります

クラスタリング(等方性ガウス)データセット生成
make_blobsを用いることでクラスタリング用の等方性ガウスデータセットを生成します。
以下は、make_blobsの引数(一部)です。
| 引数 | 説明 |
| n_samples | サンプルの数 |
| n_features | 特徴量の数(次元数) |
| centers | 中心の数(分類数) |
| cluster_std | クラスターの標準偏差 |
| return_centers | Trueの場合中心の位置を返す |
| random_state | 乱数のシード |
クラスタリングの例では、クラスタ数を4としました。
import numpy as np
import matplotlib.pyplot as plt
from sklearn.datasets import make_blobs

X, Y = make_blobs(random_state=42,
                  n_samples=1000,
                  n_features=2,
                  cluster_std=2,
                  centers=4)

plt.scatter(X[:, 0], X[:, 1],  c=Y, s=25)
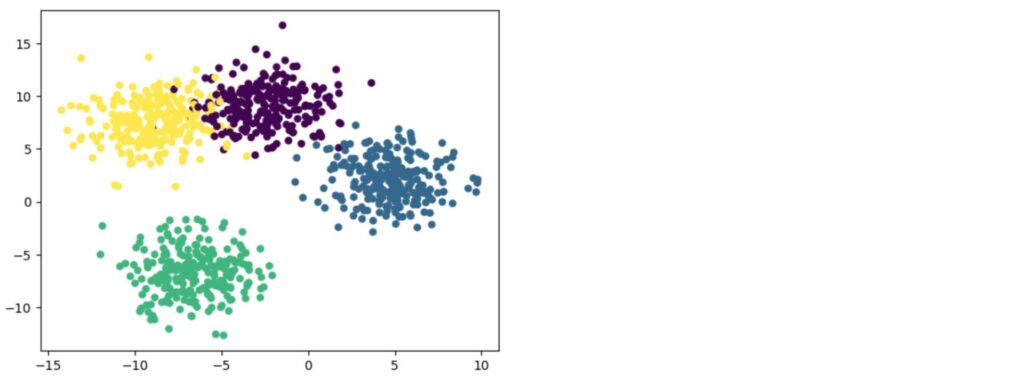
以下が、生成されたデータセットになります。等方性ガウスでデータが生成されるので、それぞれのクラスタの分布が「ガウス分布」っぽくなっているのがわかると思います。


make_classificationで生成したものとは、分布の形状が違うことがわかると思います
まとめ
機械学習の実験を行う場合にはデータセットが不可欠です。scikit-learnには、いくつかのデータセットが用意されていますが、やりたい実験にマッチしないこともあります。そういった場合は、データセットのジェネレーターを使ってデータセットを生成するのも1つの選択肢になります。

データセットの生成は、学習時にも使えるので【初級 深層学習講座】の1つとして記事にしました。


